Four years later, and my time at university has come to a close. I have earned my Masters. My time here is at a close. It is a bitter-sweet day. After The Ceremony everyone went outside for a year photo.
We took photos of Jet, LLoyd, Daniel, Me, Andy, and Edmund. And finally enjoyed the reception.
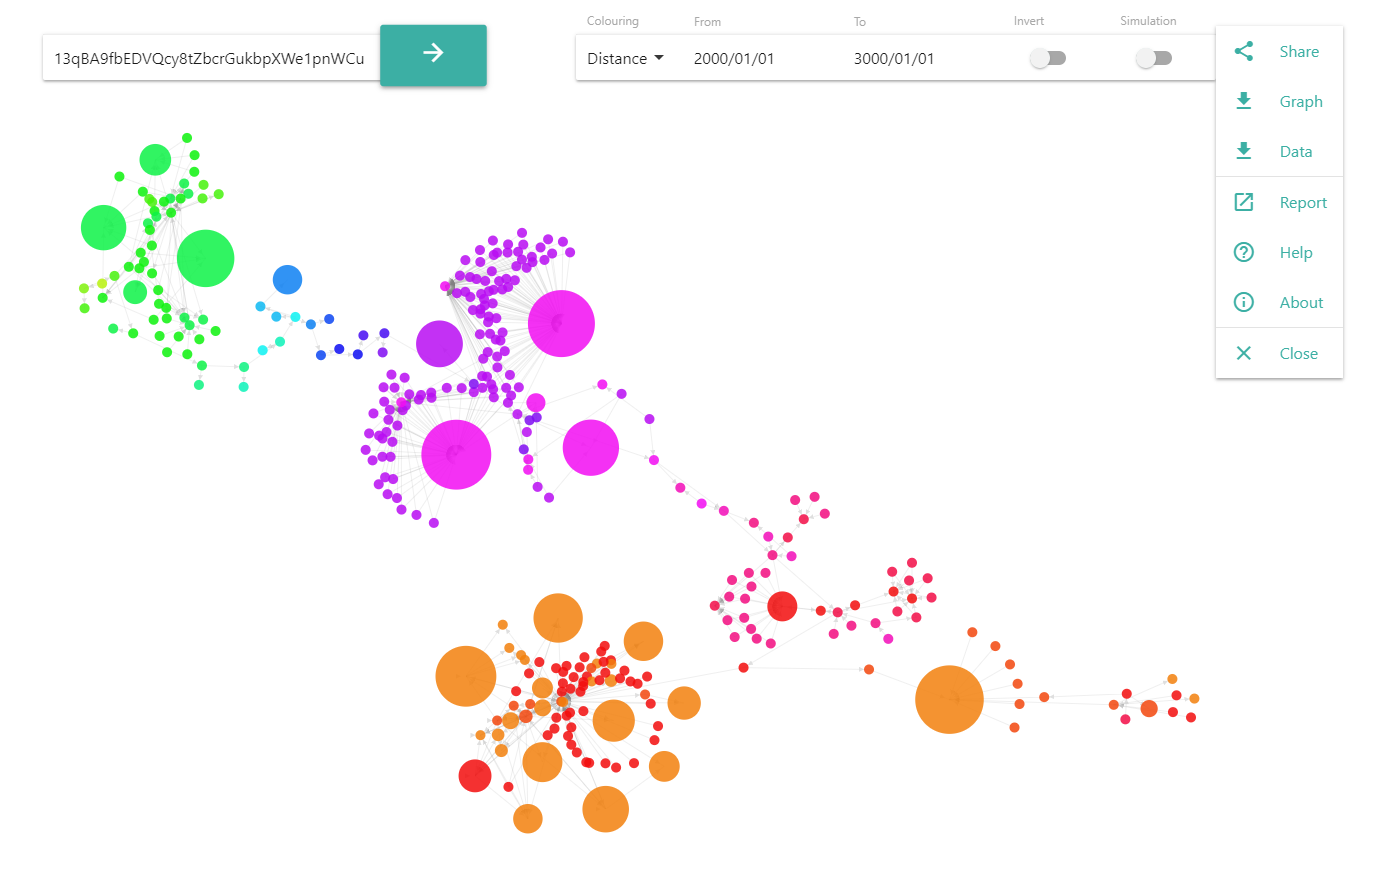
This project demonstrates the ability to visualize, and trace transactions through the Bitcoin network, evaluating three different methods. Namely poison, haircut and First-In-First-Out (FIFO).
To achieve this, a web application was created to first build up a network graph representing Bitcoin addresses as nodes, and transactions as directional edges. This allows the user to easily grasp the history of any given Bitcoin address, and then trace any transaction either up or down the graph.
By clicking on a node in the graph, the application will automatically load that address and it’s associated transactions, adding it to the graph. By hovering over a node in the graph, the tool-tip on the right will appear. It displays a number of useful statistics about the address, and gives the user the option to trace transactions by clicking on any of the colourful buttons.
This year in a team of five, we set out to investigate and experiment with the oneM2M standard, for our client InterDigital. Overall we were successful, here are our findings:
For the mass deployment of the Internet of Things to be a success, a global standard for machine to machine communication needs to become established. This report explores the oneM2M standard for Machine to Machine communication, researching its capabilities, how to make use of it, and ultimately builds systems upon it. Using them, data streaming, live video, and federation are put to the test.
This project is a oneM2M research project, with InterDigital as the client. They have created the oneTRANSPORT data marketplace, and this report with federate with their system, to demonstrate oneM2M.
When making decisions, people negotiate to maximise utility and social welfare - agents are no different. Utilizing the GENIUS framework, this report tests time dependent concessions, and fitness proportionate selection putting them to test in a negotiation competition. The results are analysed and discussed.
Diving into Net Neutrality, this report will examine why it is so controversial. It will outline the social, economic, and technical arguments both for and against. Finishing with a discussion.
CCS Concepts: Social and Professional Topics → Net Neutrality.
General Terms: Networks, History, Politics.
Keywords: Net Neutrality, Free Speech, Internet, World Wide Web.
Introduction
We live in the information age. Today people can effortlessly research, create, and communicate with anyone on earth in a fraction of a second. But where did it begin?
It’s done, it’s over! Months in the making, my dissertation is finished an available from lect.me. My advice for future students, is to start early. Projects like these always take longer then you expect.
Last The Night is a procedurally generated first person survival game in which the player fights for their life after having crash landed on a mysterious, unknown planet. Armed with only a pistol, the player must fight off the various monsters inhabiting the planet, and only once the sun rises will they be safe.
With seed based world generation, there are literally millions of planets to explore with no two being the same, and with the addition of Easy, Medium and Hard difficulties, advanced players can challenge themselves whilst beginners can get a feel for the game. Last The Night features 17 different types of monsters, keeping the player guessing at all times.
Using your flame-thrower, wrack up points and burn the forest down. Single player, play with a mouse/keyboard or Xbox 360 controller. A student game created at the University of Southampton during the Southampton Code Dojo. Burn down everything!.
A fully narrated re-telling of the fairy tale classic. Single player, play with a mouse/keyboard or Xbox 360 controller. A student game created at the University of Southampton by Matthew Consterdine and Jeff Tomband. Download and play.
Having previously created games in my spare time and in competitions, I chose to team up with three different partners to create games focusing on gameplay, narrative experiences, and innovative technology using Unity. It was hard, took a lot of work, but in the end it was one of the most satisfying modules I ever took at University. Shout out to Rikki Prince, Dave Millard, and Tom for running such and excellent module.
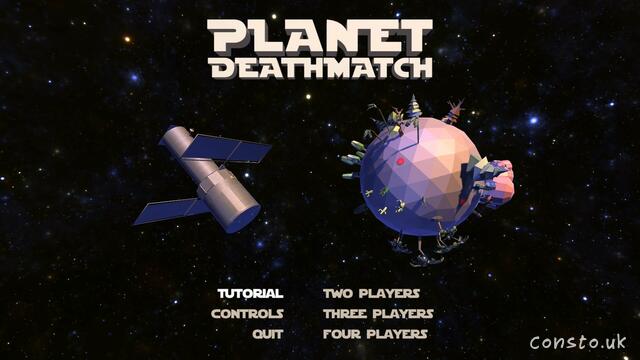
A fast paced, Quake inspired, local multi-player, little planet deathmatch infinite arena shooter. Hone your skills, then compete against your friends to see who can dominate the playing field. Supports up to 4 player split-screen, bring an Xbox controller. A student game created at the University of Southampton by Matthew Consterdine and Ollie Steptoe.
Featuring a number of classic weapons:
Shotgun: The short to medium range wild card, capable of one shotting your target, or missing entirely.
Launcher: Fires explosive rockets, knocking back all the enemies in your way. Just be careful not to get caught in the blast.
Pistol: Are your opponents not on fire? Well, that’s where the pistol comes in, it fires incendiary rounds igniting targets.
Axe: A visceral weapon that can end your opponent in a couple of hits.
I decided to investigate Machine Learning using MATLAB.
Posterior Probability
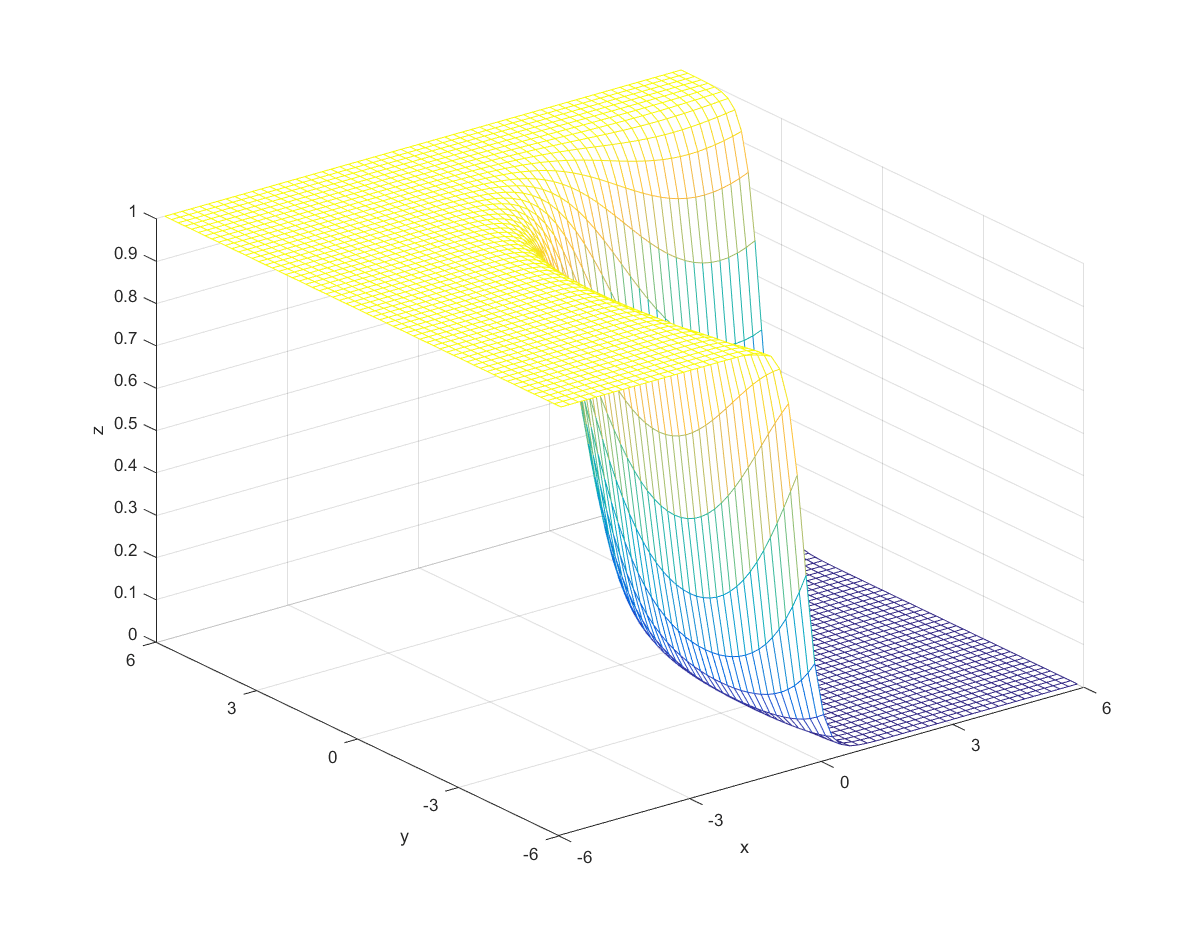
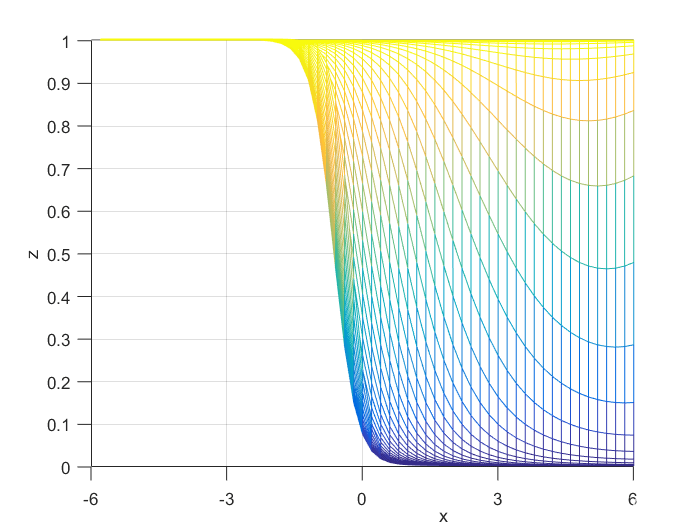
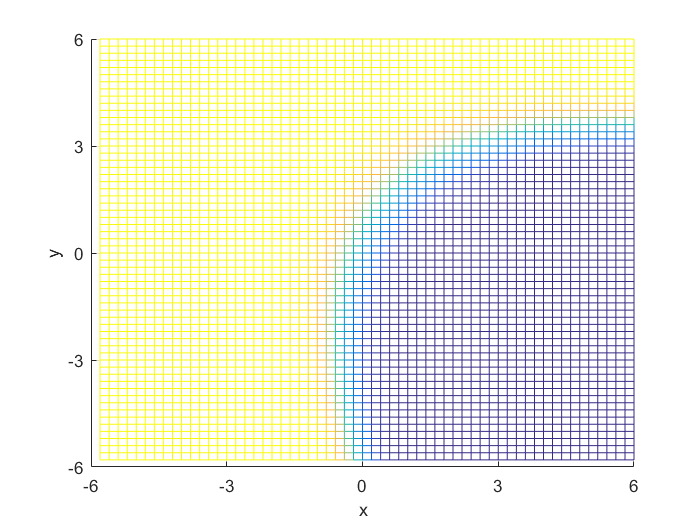
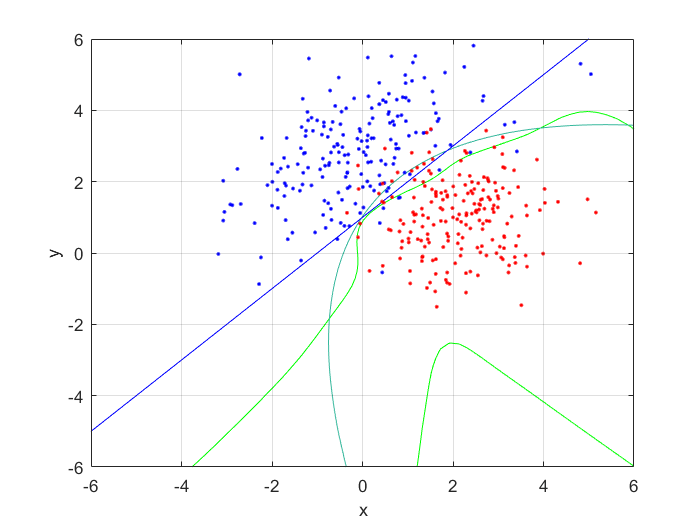
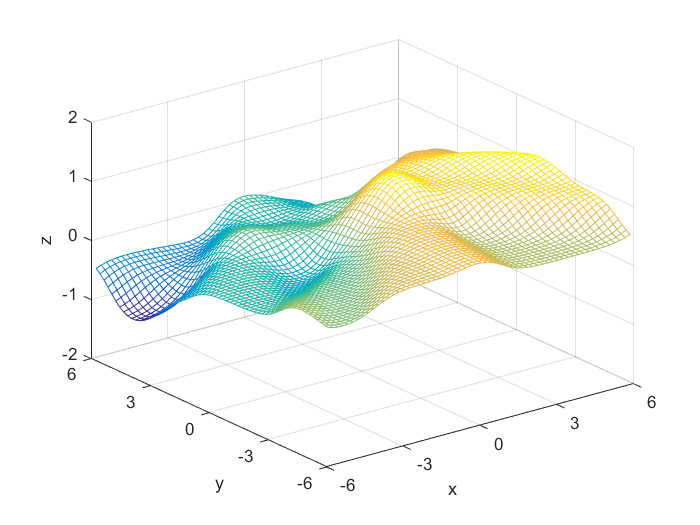
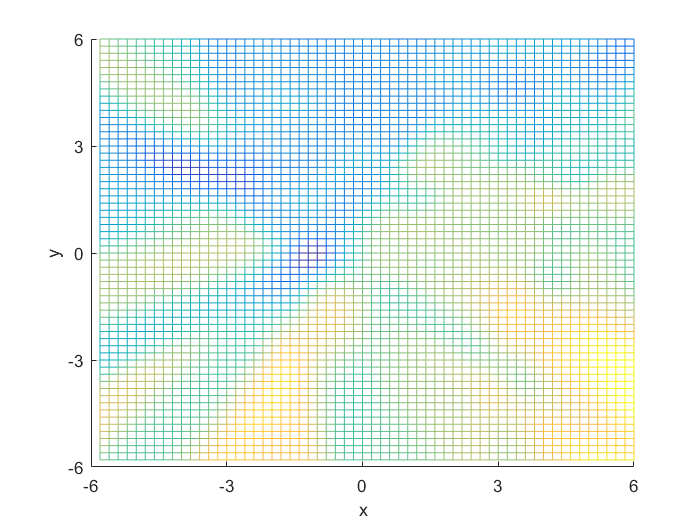
To compute the posterior probability, I started by defining the following two Gaussian distributions, they have different means and covariance matrices.
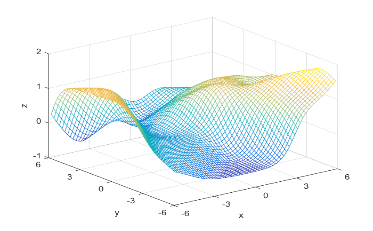
Using the definitions, I iterated over a N×N matrix, calculating the posterior probability of being in each class, with the function mvnpdf(x, m, C); To display it I chose to use a mesh because with a high enough resolution, a mesh allows you to see the pattern in the plane, and also look visually interesting. Finally, I plotted the mesh and rotated it to help visualize the class boundary. You can clearly see that the boundary is quadratic, with a sigmodal gradient.
Classification using a Feedforward Neural Network
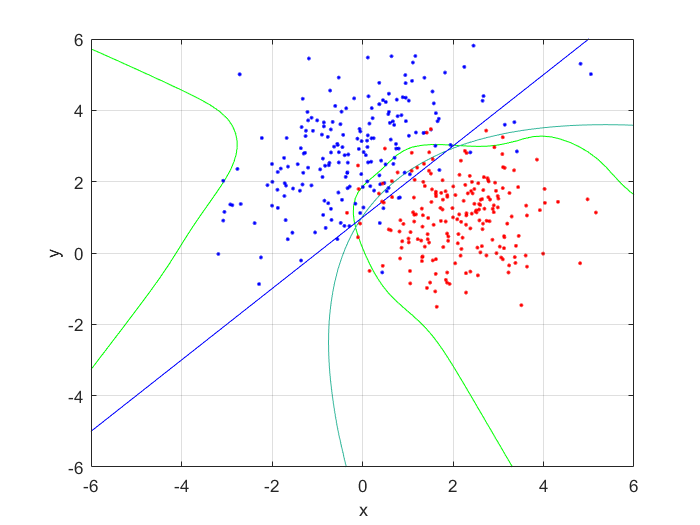
Next, I generated 200 samples with the definitions and the function mvnrnd(m, C, N);, finally partitioning it half, into training and testing sets. With the first of the sets, I trained a feed-forward neural network with 10 hidden nodes; with the second, I tested the trained neural net, and got the following errors:
Normalized mean training error: 0.0074
Normalized mean testing error: 0.0121
These values are both small, and as the testing error is marginally larger than the training error, to be expected. This shows that the neural network has accurately classified the data.
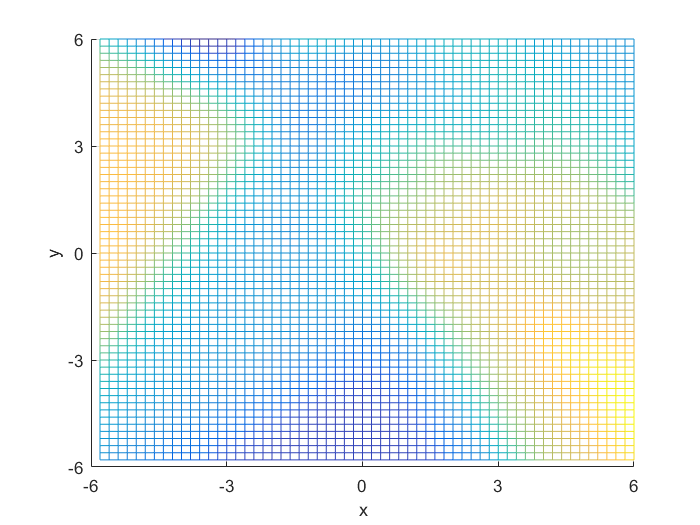
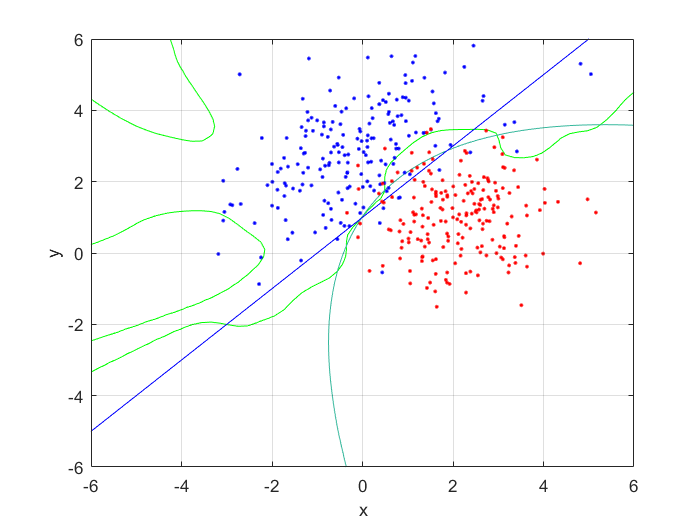
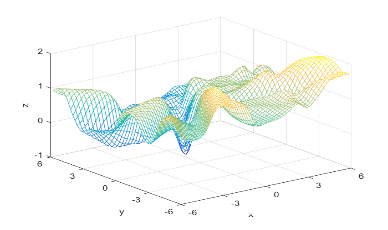
I compared the neural net contour (At 0.5) to both a linear and quadratic Bayes’ optimal class boundary. It is remarkable how significantly better Bayes’ quadratic boundary is. I blame both the low sample size, and the low number of hidden nodes. For comparison, I have also included Bayes’ linear boundary, it isn’t that bade, but still pales in comparison to the quadratic boundary. To visualize, I plotted the neural net probability mesh. It is interesting how noisy the mesh is, when compared to the Bayesian boundary.
Next, I increased the number of hidden nodes from 10, to 20, and to 50. As I increased the number of nodes I noticed that the boundary became more complex, and the error rate increased. This is because the mode nodes I added, the more I over-fitted the network. This shows that it’s incredibly important to choose the network size wisely; it’s easy to go to big! After looking at the results, I would want to pick somewhere around 5-20 nodes for this problem. I might also train it for longer.
Training Error: 0.0074 at 10 nodes, 0.0140 at 20 nodes, and 0.0153 at 50 nodes.
Testing Error: 0.0121 at 10 notes, 0.0181 at 20 nodes, and 0.0206 at 50 nodes.
Macky-Glass Predictions
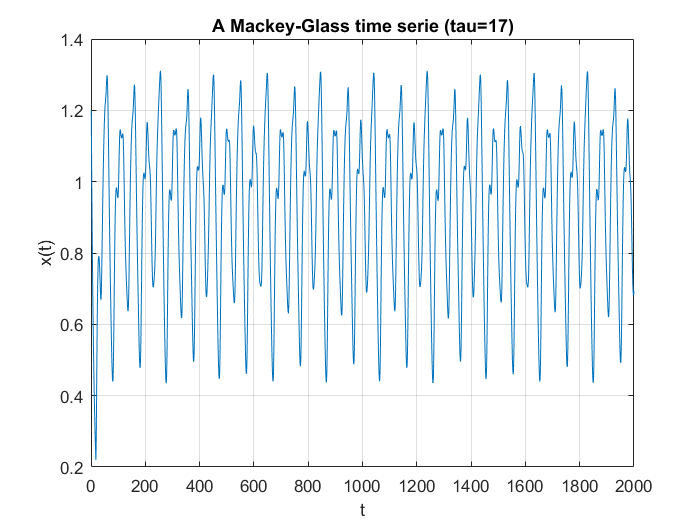
I was set the task of first generating a number of samples from the Mackey-Glass chaotic time series, then using these to train and try to predict their future values using a neural net. Mackey-Glass is calculated with the equation:
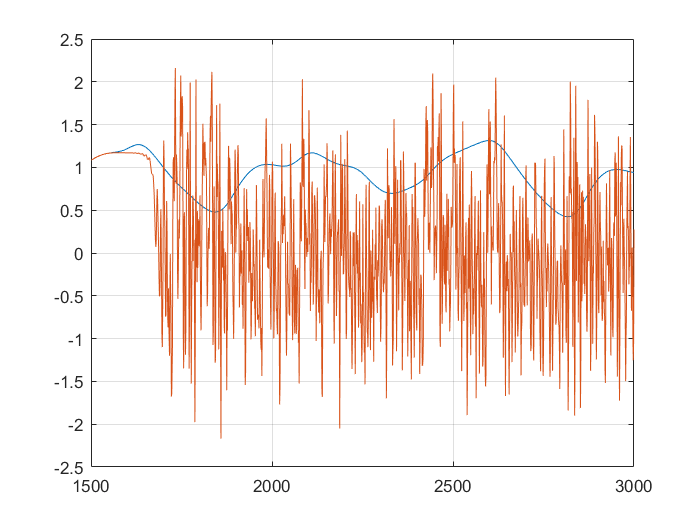
For the samples, I visited Mathworks file exchange, and downloaded a copy of Marco Cococcioni’s Mackey-Glass time series generator: https://mathworks.com/matlabcentral/fileexchange/24390. I took the code, and adjusted it to generate N=2000 samples, changing the delta from 0.1 to 1. If I left the delta at 0.1, the neural network predicted what was essentially random noise between -5 and +5. I suspect this was due to the network not getting enough information about the curve, the values given were too similar. You can see how crazy the output is in the bottom graph. Next, I split the samples into a training set of 1500 samples, and a testing set of 500 samples. This was done with p=20. I created a linear predictor and a feed-forward neural network to look at how accurate the predictions were one step ahead.
Normalized mean linear error: 6.6926×10^-4
Normalized mean neural error: 4.6980×10^-5
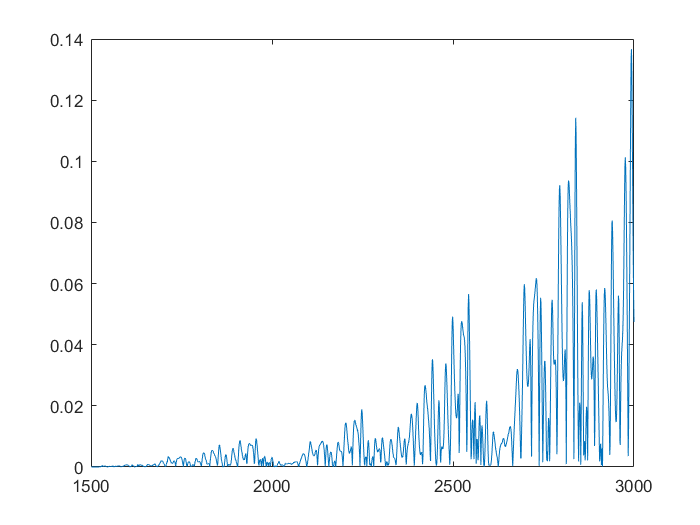
This shows that the neural network is already more accurate, a single point ahead. If you continue, feeding back predicted outputs, sustained oscillations are not only possible, the neural net accurately predicts values at least 1500 in the future. In the second and third graphs, you can notice the error growing very slowly, however even at 3000, the error is only 0.138
Financial Time Series Prediction
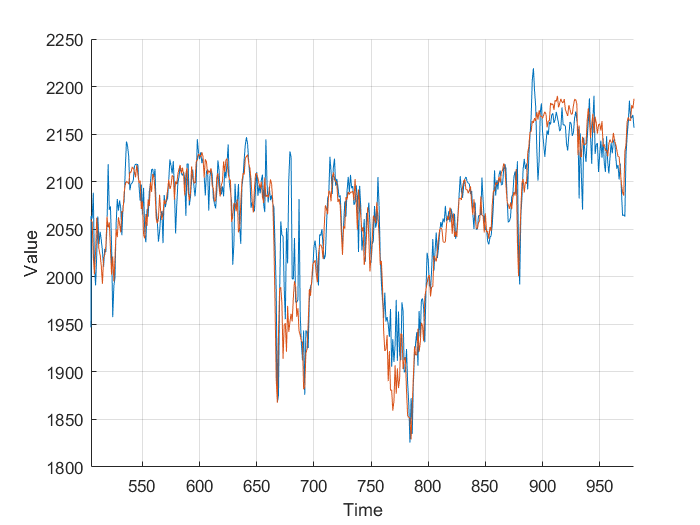
Using the FTSE index from finance.yahoo.com, I created a neural net predictor capable of predicting tomorrows FTSE index value from the last 20 days of data. To keep my model simpler and not over-fitted, I decided to use just the closing value, as other columns wouldn’t really affect the predictions, and just serve to over-complicate the model.
Feeding the last 20 days into the neural net produces relatively accurate predictions, however some days there is a significant difference. This is likely due to the limited amount of data, and simplicity of the model. It’s worth taking into account that the stock market is much more random and unpredictable than Mackey-Glass.
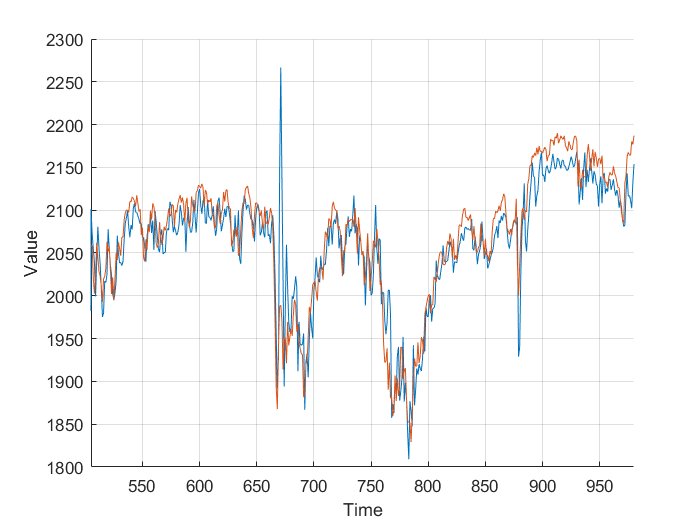
Next I added the closing volume to the neural net inputs, and plotted the predictions it made. Looking at the second graph, it’s making different predictions, which from a cursory glance, look a little more in-line.
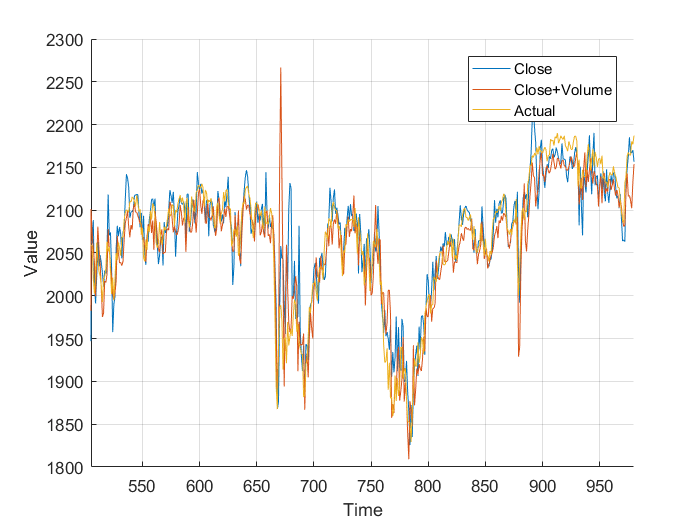
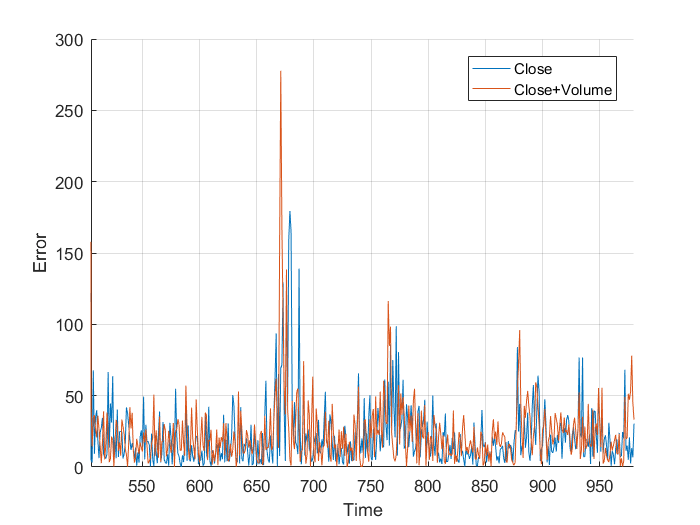
However, I wasn’t sure so I plotted them on the same axis, and, nothing really. It just looks a mess. Plotting the different errors again gives nothing but a noisy, similar mess. Finally, I calculated the total area, the area under the graph and got:
Normalized close error: 9.1066×10^5
Normalized close+volume error: 9.1180×10^5
This is nothing, a different of 0.011×10^5 is nothing when you are sampling 1000 points. It works out to an average difference of 1.131, or 0.059%. From this I, can conclude that the volume of trades has little to no effect on the closing price, at least when my neural network is concerned. All that really matters is the previous closing values.
Overall, there is certainly an opportunity to make money in the stock market, however using the model above, I wouldn’t really want to make big bets. With better models and more data, you could produce more accurate predictions, but you still must contest with the randomness of the market. I suggest further research before betting big.
This is the user manual for the Aqua programming language created as part of Programming Languages and Concepts. Visit the project on Github.
Aqua is a C-like imperative language, for manipulating infinite streams. Statements are somewhat optionally terminated with semicolons, and supports both block ( /* ... */) and line comments ( // ...).Curly brackets are used optionally to extend scope. Example code can be found in the Appendices.
Before continuing, it’s helpful to familiarise yourself with Extended BNF. Special sequences are used to escape.
Usage Instruction
Once the interpreter has been compiled using the make command, you can choose to run an interactive REPL or a stored program. Executing ./mysplinterpreterwith no arguments will start in an interactive REPL . You should save your program files as <filename>.spl and pass the location as the first argument to ./mysqlinterpreter. As data is read from standard in, you can pipe files in using the < operator, or pipe programs in using the | operator, allowing you to create programs that manipulate infinite streams.
Starting the interactive REPL: ./mysplinterpreter
Executing a saved program: ./mysplinterpreter <file> [ < <input> ]
Using infinite streams: <program> | ./mysplinterpreter <file>
Programs are executed in multiple stages:
Entire program is loaded into a string (Unix line endings required)
Program is lexed into Tokens
Tokens are parsed into an Abstract Syntax Tree (Left associative with the exception of lambdas)
Block world is a simple 2D sliding puzzle game taking place on a finite rectangular grid. You manipulate the world by swapping an agent (In this case the character: ☺) with an adjacent tile. There are up to 4 possible moves that can be taken from any tile. As you can imagine, with plain tree search the problem quickly scales to impossibility for each of the blind searches.
It is very similar to the 8/15 puzzles, just with fewer pieces, meaning it’s simpler for the algorithms to solve. It’s unlikely any of my blind searches could solve a well shuffled tile puzzle with unique pieces, but I suspect my A* algorithm could. However, before doing so I would want to spend time improving my Manhattan distance heuristic, so it gave more accurate results over a larger range.
I decided to use Java to solve this problem, as I’m familiar with it and it has a rich standard library containing Queue, Stack, and PriorityQueue. These collections are vital to implementing the 4 search methods. You can implement the different searches differently, but the data structures I listed just deal with everything for you.
I produced a series of bash scripts to automate the process of pinging the list of websites. I choose bash as it is trivial to pipe the output from ping into various other command line programs such as: sed, gawk, and wget. As it was completely automated I decided to start early and just let it run. In total I pinged the top 100,000 websites up to 100 times each using script.sh (See Appendix A), recording useful statistics.
The script is very simple; a while loop to iterate over each site, and ping/ping6 piped into gawk to process the result. Gawk is very good at processing this sort of data, and more than fast enough to perform the task. The result was output to a large (11.1MiB) CSV file, with the IPv4 and IPv6 of each site, on separate lines.
As part of creating this script, I assumed that every site, if it exists would be able to respond within 10 seconds if it was online. If not, my script would timeout and assume the site was down. I feel this is a reasonable assumption as any remotely popular site should respond quickly, unless it’s currently being DDOSed. Another assumption I made is that any site I scanned would be able to withstand 5 requests per second. Even a raspberry pi is capable of serving 43 static pages per second1. As I sent a maximum of 50 requests, the brief period of slightly increased load should be negligible for any of the sites I scanned.
In hindsight, I would have combined both IPv4 and IPv6 into a single line from the start, as manipulating the data in excel is significantly easier to do if it is all on a single line. By that time I had already scanned the top 100,000 site’s so simply regathering the data was impossible. To fix this, I created combine.sh (See Appendix B) which simply echo’s the IPv4 line without a newline, then the IPv6 line with one. This is the reason I have some duplicated columns in my combined output. These are removed in Appendix D.
Whilst looking through the IPv6 column I noticed a very common prefix: “2400:cb00:”. After some research I discovered that this prefix belongs to cloudflare2. Using the prefixes I found on whatmyip.co3, I created a table mapping the hosting company to the number of sites it hosts. The results are impressive.
I decided to lookup the geolocation of each website. Looking around for a convenient database or API, I stumbled upon freegeoip.net4. It allows you to easily gather geolocation information for a specified IP in CSV form, perfect for my coursework. To retrieve this information using lookup.sh (See Appendix C) I self-hosted my own instance, then used cURL and a simple while loop to request and printf all the location information about each site to a file. I decided to record all the information given, to keep the script simple and retain all the information, to ensure I didn’t need to re-run the script.
Once the data was collected, it was time to head to Excel to analyze the data and draw conclusions. Having a large dataset let me create very good graphs, and draw good conclusions but was tedious to work with in Excel. Certain formulas, such as the ones used to create the Average Response Time per Country over Distance graph, managed to crash Excel numerous times and it even ran out of memory every now and then. In future when dealing with similarly sized amounts of data I would need to look into other graphing tools.
Results
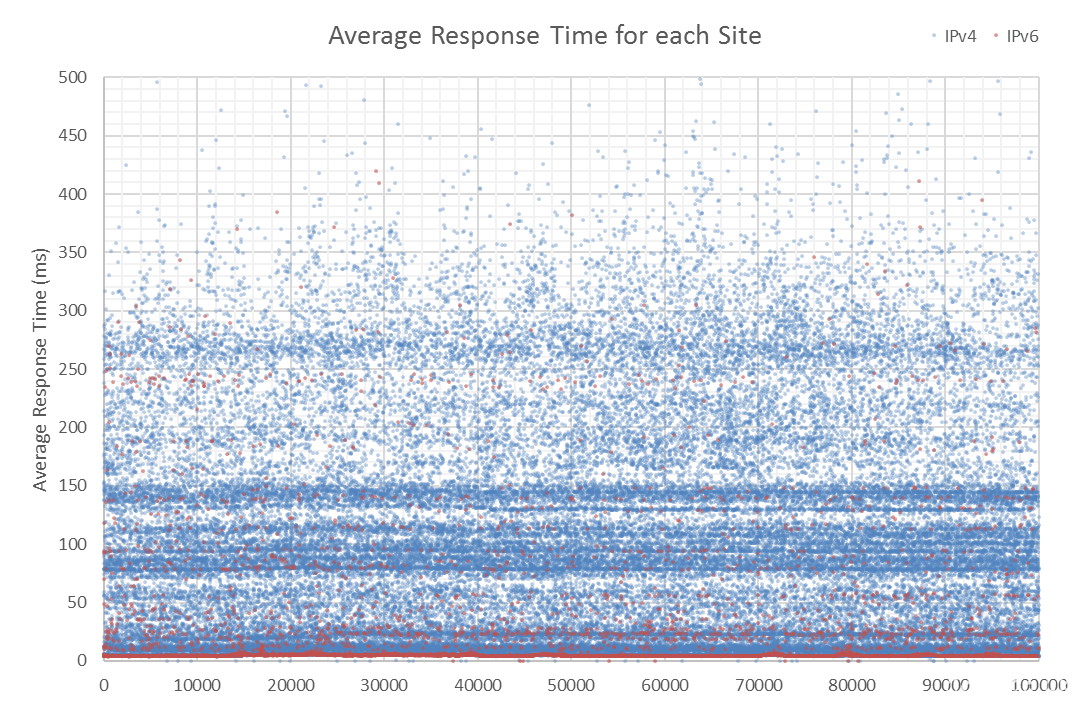
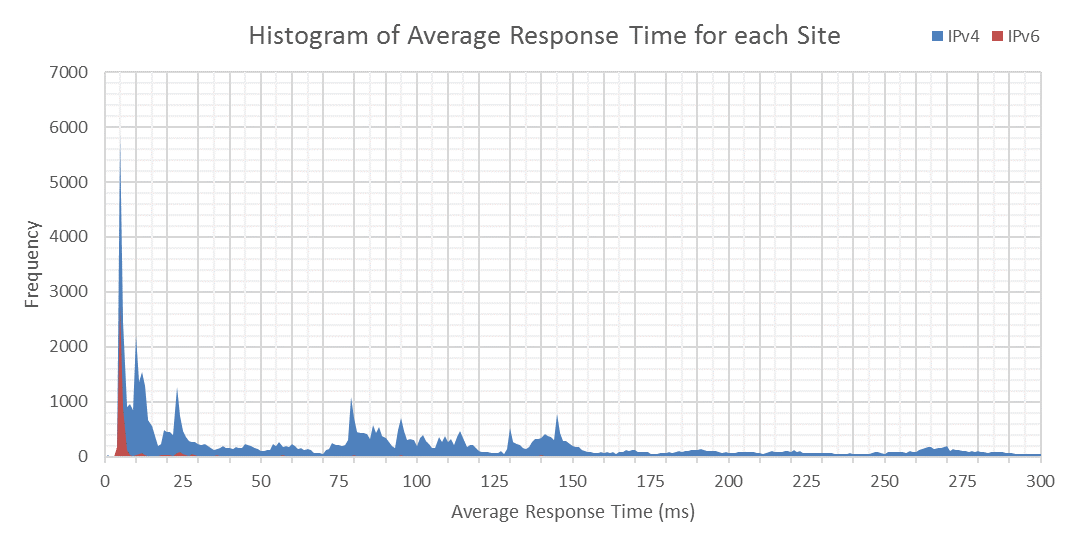
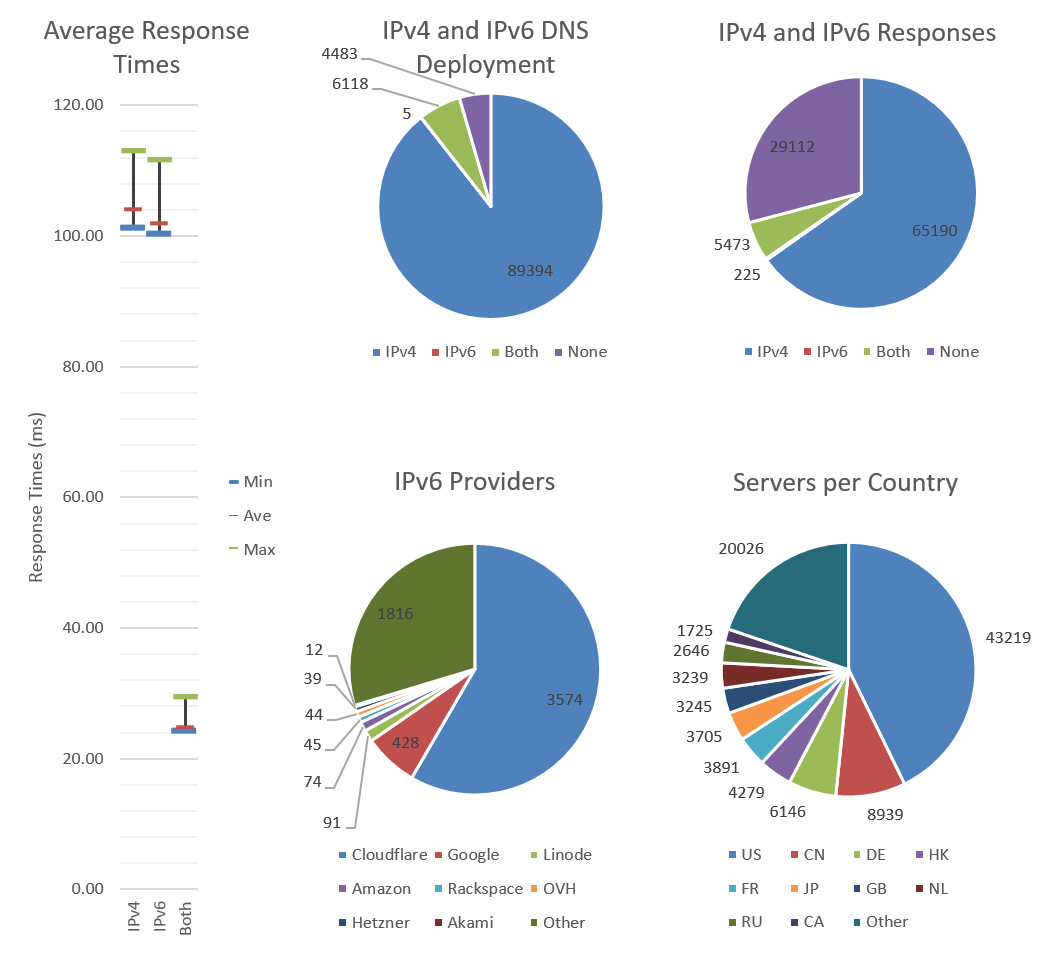
I decided to plot all 100,000 points as an X-Y scatter. In this, and subsequent graphs, IPv4 is blue and IPv6 is red. Immediately I noticed rather obvious bands of pings, which are shown in the Histogram, below. There are large peaks in the graph above. It’s interesting to note that despite the lower adoption of IPv6, the initial peak is half the height of IPv4. Past that, the frequency is low, indicating lower IPv6 response times.
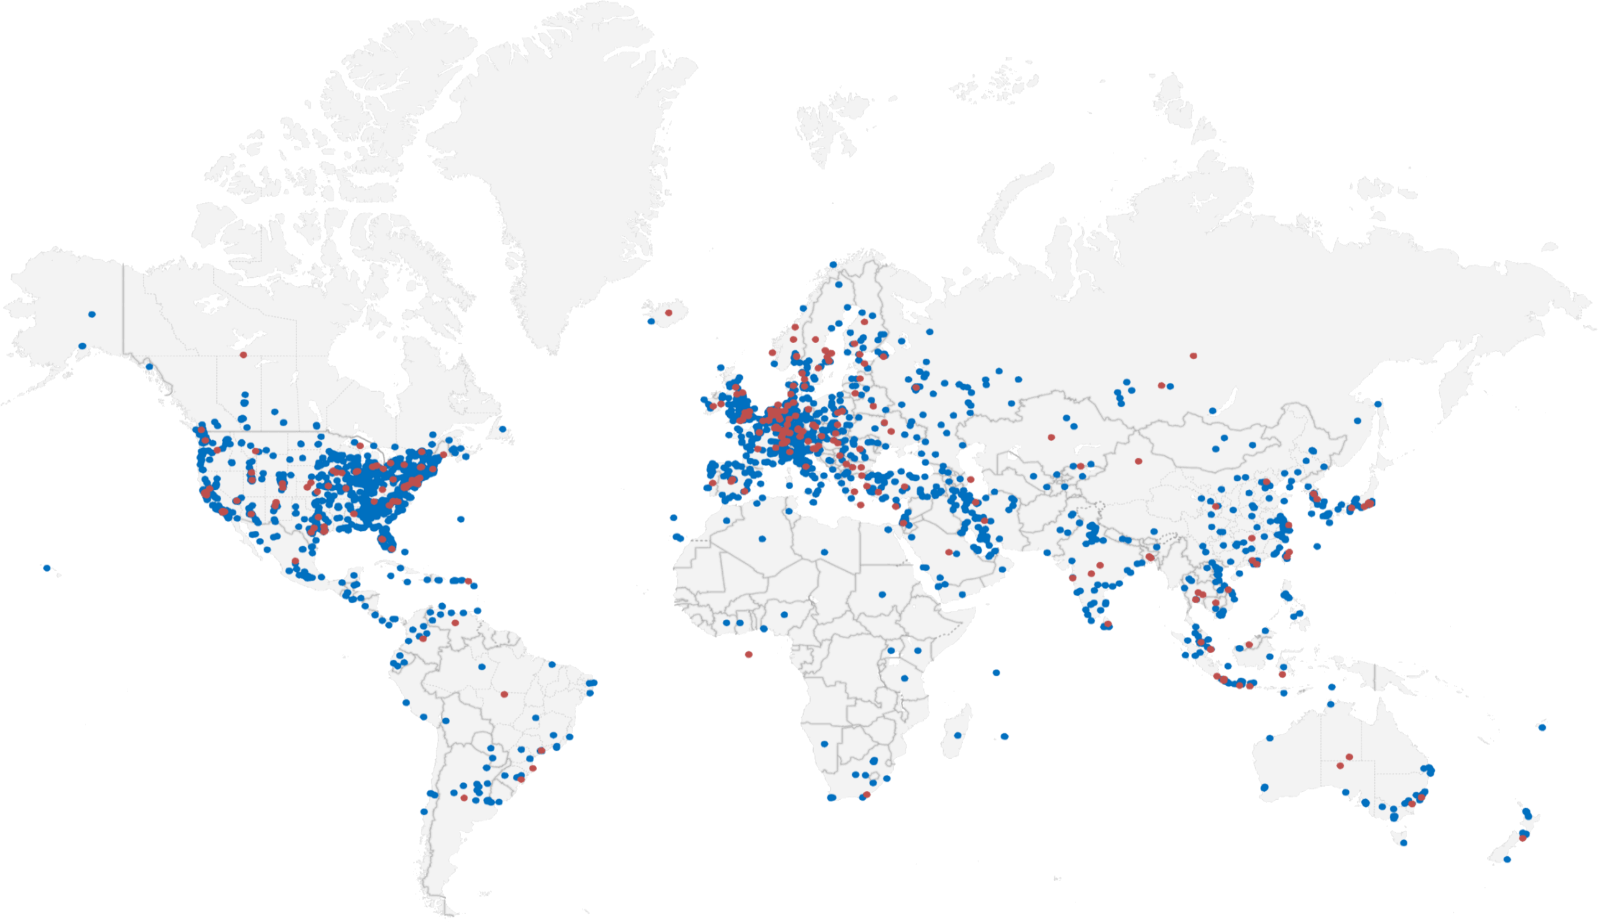
Thanks to CDNs and local sites, the top 1000 sites are concentrated around the 4-6ms mark with both averages trending slowly upwards. IPv6 is always significantly lower than IPv4 in the graph above. From a glance, you can see regions such as Africa, the Caribbean, and the Middle East without any IPv6 deployment. Sites are concentrated around the U.S.A, Europe and East Asia, with barren areas in-between.
Average response times for IPv4 only and IPv6 only sites is roughly the same at about 104ms. The average min and max are largely identical as well; nothing surprising. On the other hand, the averages for sites running both IPv4 and IPv6 is very low in comparison – only 25ms compared with over 100ms! Now the question is, why are sites running both IPv4 and IPv6 significantly faster?
A Vast majority of 90% of the Internet is IPv4 only, with only 4.5% of sites providing both. In fact, more sites provide neither than both! It’s impossible to not have an IPv4 address and be truly connected.
A large number of the top 100,000 websites are either blocking ICMP echo requests (ping) or are simply offline. Alternatively they could only be only listening to a specific sub-domain. I didn’t check for this.
One reason sites that provide both IPv4 and IPv6 are faster, is that 65% of them are behind Cloudflare, or Google. Both have worldwide CDNs, and Cloudflare provides a free IPv6 gateway; allowing IPv4 only sites to be connected to using IPv6.
The U.S.A. is the world leader in number of hosted sites with 43% of the market. Comparatively, every other country is trailing behind with Canada at 9%, Germany at 6%, and Hong Kong at 6%. This is despite the existence of global CDNs.
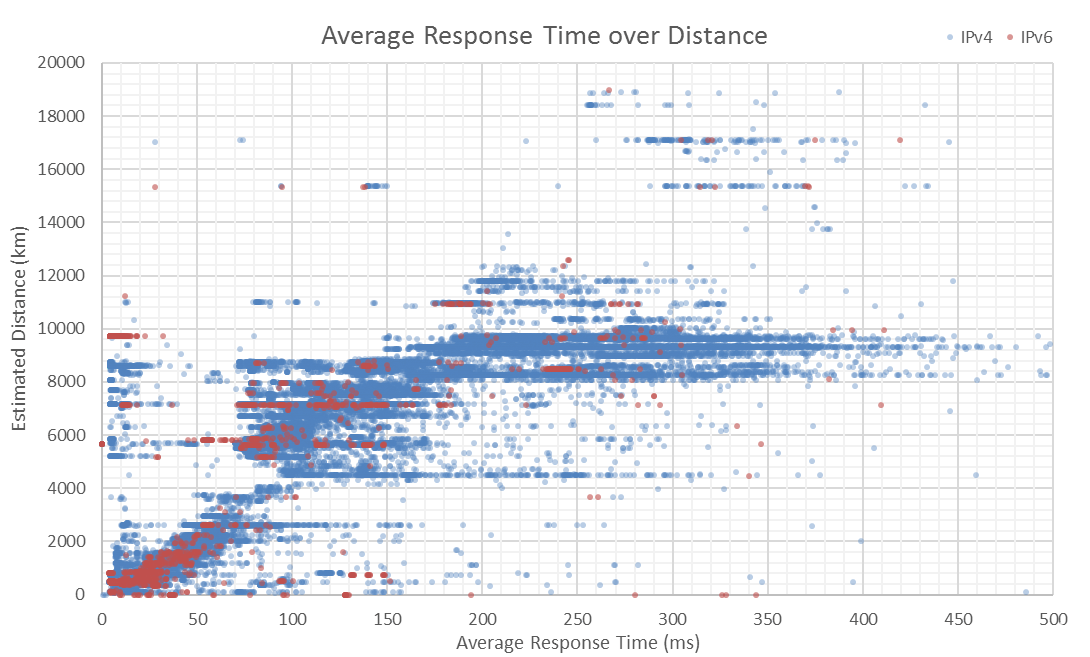
To test the geo-location accuracy, I potted estimated distance, over average response time. Sites above the diagonal are likely closer than their IP suggests. Sites below the diagonal simply have a poor connection. Besides a colourful graph, this shows the grouping of sites in different countries; explaining why there are so many peaks in the Histogram. There is a minimum amount of time it takes to connect to distant hosts.
Discussion
Limitations
I only ran the script once, and as the script took easily a week to analyze the top 100,000 sites, chances are the sites at the top had changed since the start. I could have gotten around this by parallelizing the script, or running it multiple times on a smaller set and taking an average. Parallelizing seemed too complex for the task at hand, and I didn’t really consider running it multiple times before it had almost finished analyzing. As I didn’t want to discard all the data, I decided to go ahead with the data I had.
The geo-location database I used isn’t 100% accurate - that is virtually impossible. You can see that it isn’t on the Average Response Time over Distance graph. Many sites are so significantly above the diagonal that the only way that the time would be possible is by breaking the speed of light; and indication that they are located much closer than their IP suggests. This is likely as common as it is, due the how exhausted IPv4 is, organizations are trading the limited number of IPv4’s that they have access to. This doesn’t really matter too much, due to the size of my data set. In future I could remove the outliers to produce cleaner results.
Speed
It is clear to see that sites that serve both IPv4 and IPv6 traffic are, on average, significantly faster than those that don’t (4 times faster on average). Every single graph I have produced shows this simple fact. I feel that this can be attributed to several factors:
Cloudflare and Google account for ~65% of all IPv6 traffic and both have global CDNs to ensure a fast and reliable connection. There are many more IPv4 sites that neither are associated with. Instead of connecting to a distance site, a CDN acts as a proxy, speeding up the time it takes to connect.
IPv6 isn’t widely deployed yet, with only 6% of sites serving it. Those 6% are usually the bigger websites; smaller sites may be stuck behind a single IPv4 address, in a data-center that doesn’t support IPv6.
Sites that serve both IPv4 and IPv6 traffic are concentrated in North America, Europe and East Asia – regions with geographically closer and better connected than the rest of the world. They are practically absent from regions such as Africa, the Caribbean and the Middle East. There is also little deployment in South America, West Asia and Oceania.
However, despite the fact that average response time for IPv6 is significantly faster than IPv4, it’s unlikely you’ll see any speed increase switching between IPv4 and IPv6 on a host that supports both. IPv6 is faster because the hosts that server both are well connected with fast response time, regardless of protocol.
Deployment
Despite the best efforts of organizations such as worldipv6launch.org, Cloudflare, and Google; IPv6 access is an afterthought. Despite claims of 500% growth since 2012, it’s 2015 and only 4.5% of sites support IPv6. As we go into the future, IPv6 deployment will surely grow as larger populations and the Internet of Things will strain the exhausted IPv4 pool even further. Until IPv6 is widespread, anyone with only an IPv6 address will be unable to connect directly to IPv4 only hosts, without the aid of a tunnel.
IPv6 isn’t evenly geographically distributed, compared with IPv4. If you’re in Africa, the Caribbean, or the Middle East, virtually no sites support IPv6. This suggests to me that the infrastructure required to support IPv6 just isn’t there.
Rank
Bigger sites are more likely to support and have a fast IPv4 and IPv6 connection than smaller sites. As you go through the different sites, the further down you get, the slower the site is to respond, on average.
For Human Computer Interaction, we were tasked with producing ‘cardboard’ prototypes, and making a video demonstrating them. The module wasn’t the best, and neither is this video, but I feel it is at least somewhat entertaining. I was involved behind the scenes, so you’ll be seeing some of my course-mates acting.
From an underground Swiss bunker to all around the world; the World Wide Web has transformed from an experiment in academic distribution to the massively interconnected strength that we know today. While the current Web is relatively new, it has not only revolutionised the world, but promises to continue as our society strives towards the Internet of Things.
This report will untangle not only the history of the World Wide Web, but its many predecessors: designed and implemented, successful and not. It shall be accomplished by studying some of the attempts at webs from the past century; starting with the Mundaneum and ending with the current Web.
As the report approaches the end, it will look at the future of Web. Devices are becoming connected with smart devices such as phones, televisions and even thermostats sharing data with themselves, and their manufacturers. Privacy has been and will continue to be an important issue as greater amounts of data is shared.
Despite their simplicity, a spirograph can create complex and visually appealing shapes. Originally designed to help prevent banknote forgeries, the spirograph is now a children’s toy sold worldwide.
Using simple mathematical equations I’ve created a simulation that creates many random Spirographs. Behind the scenes each Spirograph is rendered to a canvas buffer which is then drawn to the main canvas for performance. Why not play, the code is on GitHub.
Click or use +/-/C to create or remove spirographs. Scroll to speed up or slow down time. Press space to play or pause the simulation. Press T to toggle trails.